Smart Lotto Statistics — 1,200+ Draws of Winning Data Inside the App
Why Put the Data Inside the App
Lottery statistics already fill the internet: draw archives, community analyses, loud headlines about “this week’s picks.” Information overflows. What Saturday afternoon often needs is a short look. Open a search box and ads, comments, and certainty arrive together. When certainty arrives, the hobby heats up, and heat is expensive around a game that cannot cool itself with results.
That is why I preferred keeping data local, inside the app. Winning numbers from early draws onward sit on the device and surface as charts and frequencies when you need them. No wandering the web. The record is in your hand, which makes it easy to attach to a routine: open, check, close. Routines like short tools.
More history does not reveal the future. Past 1,200 draws, the next round is still open randomness. Data lives in the app not to make you win, but to offer choosing material quietly. Quiet is the point. Quiet is also the missing ingredient in most “analysis” content, which survives by sounding urgent.
I wanted a place where the past could be browsed without a chorus telling you what it means.
What Stats Show — and What They Don’t
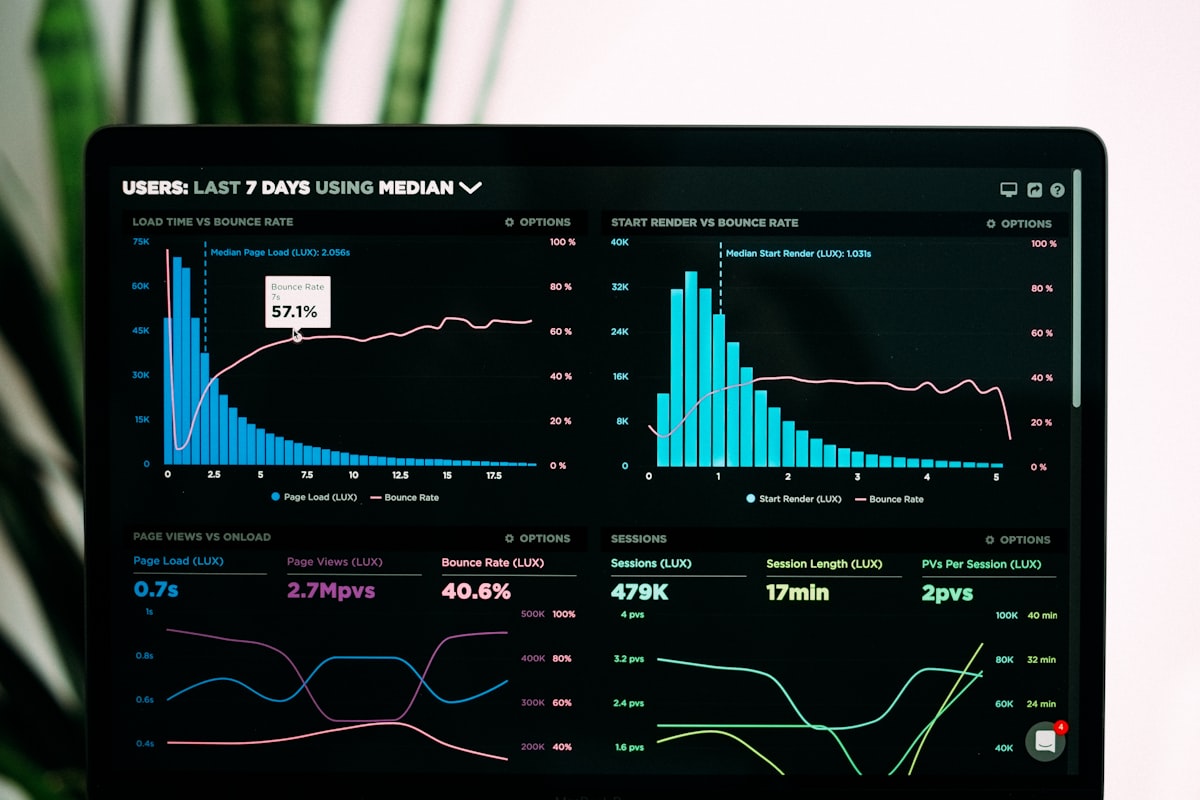
A stats screen usually shows frequency by number, long-quiet digits, distributions like odd/even or tail digits. Patterns seem to appear. That feeling is natural. Humans are built to read stories out of bars and tables, even when the underlying process does not owe those stories a sequel.
What stats do not show is also clear: next week’s answer. Frequent numbers are not guaranteed to return. Cold numbers are not owed an appearance as compensation. Statistics summarize the past. A summary can help taste; it cannot replace the draw. Help and replacement are different jobs, and confusing them is how dashboards become superstition engines.
Keep that border and stats are fun. Cross it and stats become homework. Homework makes people act like analysts, and analysts find it easy to buy more — “I studied, so this many tickets are justified.” That sentence breaks budgets with the dignity of diligence.
If a chart needs a second chart to “confirm,” you have already stayed too long. One screen, one glance, one condition — then leave.
The Distance Local Data Creates
The problem with web stats is often less accuracy than surrounding noise. The same digits, plus a comment saying “this week is the one,” can shake the hand. Charts inside an app reduce that noise. Numbers and you remain. That distance thins over-interpretation and keeps the ritual from becoming a debate with strangers.
Updating as draws accumulate is closer to keeping a record than to running a prophecy engine. A maintained record lets you compare last week and this week on one screen. Comparison feeds curiosity. Fill curiosity and stop, and statistics stay healthy material. Curiosity without a stop sign becomes collection for its own sake.
I do not want users lingering forever in front of charts. A short look, one condition, generate, buy. Stats are only the first button in that flow. Make the first button too flashy and the whole outfit gets heavy. Heavy outfits are hard to wear every Saturday.
How to Use It as Material
Smart Lotto’s statistics screen processes historical winning data for display. Please do not treat it as a must-win dashboard. Treat it as material for the fun of picking. It does not claim better odds. It claims a quieter archive.
Having data in the app means you can open the past whenever you want. Opening the past and owning the future are different acts. Take only the first and statistics become light observation. A Saturday with light observation can be a little more interesting than one without. That is enough — and enough is the most honest promise a stats screen can keep.